NQ is following Feigenbaum projection perfectly so far on the daily timeframe. After accumulation, a perfect manipulation to -0.6714 and then distribution to 3.5699. Now after a retrace to 1, it's ready to finish the move up to 4.6692 at close to 22K. Based on time fib I expect the top to be in November (between blue vertical lines).
Based on the swing time projection I expect NQ to form a new high between Nov 26th and 28th. This could coincide with price projection from March 2024 with expected top around 22K. Both time and price based on Feigenbaum projections.
Based on time fib and Feigenbaum projections the swing predictions seems pretty accurate. Comments in chart. Would line up with projection on Daily TF since March 24, with expected top around 22K.
DXY is ready for a leg down, after bear div and topping within projected time on Daily. On 4H it's building up to a nice #SBS shape, where we can expect a move down. 4H time projection says downwards into start of, or mid, February.
This is my current expectation. Comments in chart. Expecting a move lower, before going higher to fulfill the 2 remaining open Feigenbaum projections. Reaching C.E. of the 4H huge wick, but not new ATH. Then free fall. Time projections based on swings and Feigenbaum time.
After completing the previous Feigenbaum projection on daily TF, UKOIL is set for a new rally based on new Feigenbaum projection. After initial accumulation, the manipulation down to -0.6714 is done, and we should now see a move up to 3.56699 at least, or all the way to 4.6692, roughly 95-101$ area.
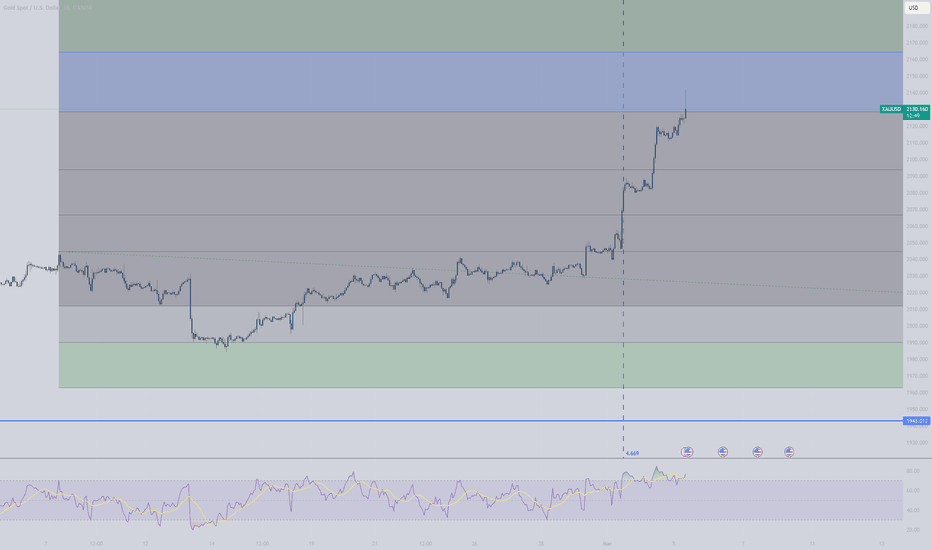
Gold followed Feigenbaum projections nicely with a retracement down to fib -0.6714 before extending higher into blue target zone between fib 3.5699 and 4.6692. Should turn down from here
The recent 63K high closed the weekly imbalance (FVG) from previous ATH at 69K. On Daily TF the Feigenbaum fib projections are panning out perfect, with a first test of 1.6714, a retracement to -0.6714 before extending to target 4.6692 (and zone above). Next move would normally be down, and reaching external liquidity at 38K frist, and then perhaps all the way...
Based on Feigenbaum projections, it seems we are in the final leg up before a bigger reversal to the downside. See how the price reacts to the Feigenbaum levels (highlighted with red dots). I expext price to reach up to 17986 before turning down. This should all happen within the blue vertical lines, which are Feigenbaum projections on the time axis.
Based on time fib for daily TF we can measure the manipulation leg that took out a HTF low or high, the next opposing high or low falls within time fib Feigenbaum constants (3,5699 and 4,6692) of the time for this manipulation leg (target areas marked with vertical dotted lines). This suggests that based on the recent high of 17165 for NS1! on 29th December 2023,...


