Marketskey
price decreased in a 5 wave motion. We are now in a flat with strong B wave(cause it exceeded 1.382 FiboExpansionwaveA ). Wave c can not retrace 100% of wave b in such a correction. There are two possibilities, its either a running or irregullar failure. Price will probably continue falling down after wave c of flat.
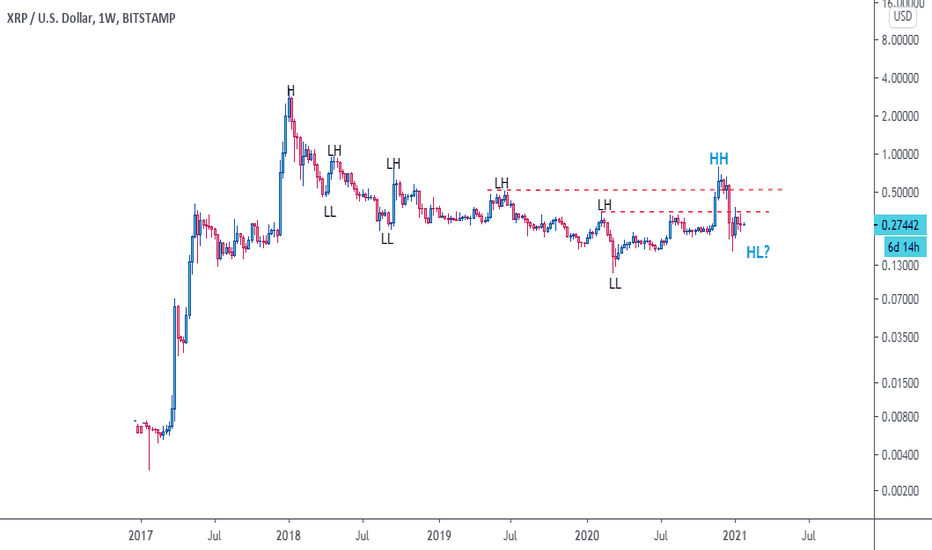
By stabilizing the higher low new upward move can begin.
In monthly timeframe we deal with a uptrend. next obvious thing is a negative Regular divergences. based to former experience on this chart a correcive phase might start here. check the red boxes.(Aug 2011 till sep2012 and nov 2015 till sep 2016). According to the acsending nature of this chart it's better not to consider -RD as a selling signal but It's crystal...
after a strong uptrend a bearish correction is occuring . there is still a good change for the second scenario to happen.
#EURGBP. You can see the chart since 1994. the price has reached its historical top (about 0.91694). Due to current waves momentum, wave analysis and comparing to the wave fomed between 2007 & 2008 it can't exceed this top and there will be bearish trend on the way in next several months. according to wave analysis, a complex correction is taking place and it is...


