Correlation goes from -1: inverse to +1 positive. 0 equals NO CORRELATION.
Sept Futures / Spot Price (Coinbase) We should expect something ranging from USD 50 to 150 (0.5% to 1.5%) Anything outside this range should be considered 'weird' @noshitcoins
( (Bitmex June/19 contract - Coinbase spot) + (OkEX 3 month forward - Coinbase Spot) ) / 2 Basically the average premium in 2 months vs spot price We should expect something ranging from USD 0 to 100 (0% to 1.8%) Anything outside this range should be considered 'weird' @noshitcoins
There seems to be 2 concurrent trends forcing Bitcoin right now: a) long-term recovery: hashrate, CME volumes, BAKKT & Fidelity launch, 2020 halving, etc b) downtrend after 13.4k overshoot: harsh remarks from Trump & team, potential Tether litigation, Libra project negative impact
Every 12 months we adjust the curve that best 'fits' historical Bitcoin BTC trend on a log chart. It's not an easy task and chart will obviously change according to historical performance. No one is trying to 'predict' the future here, but instead find previous exaggerations which tends to happen a lot on early stages pricing.
Tether Market Cap vs BTC Price -- please note that Tether prints & redemptions take 20 to 25 days until impacting Bitcoin price. This correlation is very strong and has been working for over 12 months
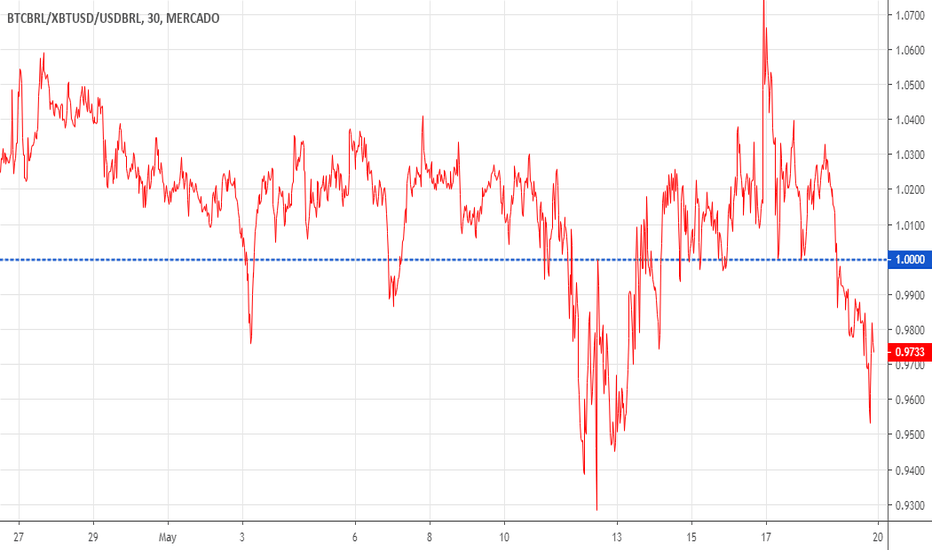
Preço do Bitcoin na MercadoBit vs Coinbase (convertido pra BRL). Positivo = Brasil mais caro // Negativo = Brasil mais barato
This chart measures Bitcoin Tether price @ Binance / Bitcoin USD fiat price @ Coinbase. If # is above 1.00 means investors value Tethers more than USD fiat. On the other hand #s below 1.00 means Tethers are trading at a discount to USD fiat. 0.98 = 2% discount. Only listed market for Tether/USD fiat is Kraken exchange but there's no real volume going on there,...
Repare como o ATH foi mais de 1 mês antes do resto do mercado, incluindo um crash de 40% nos dias seguintes
Chart que acompanha o ágio Brasil: Mercado Bitcoin / Coinbase / Dólar Comercial


