IOTAUSD trade ideas
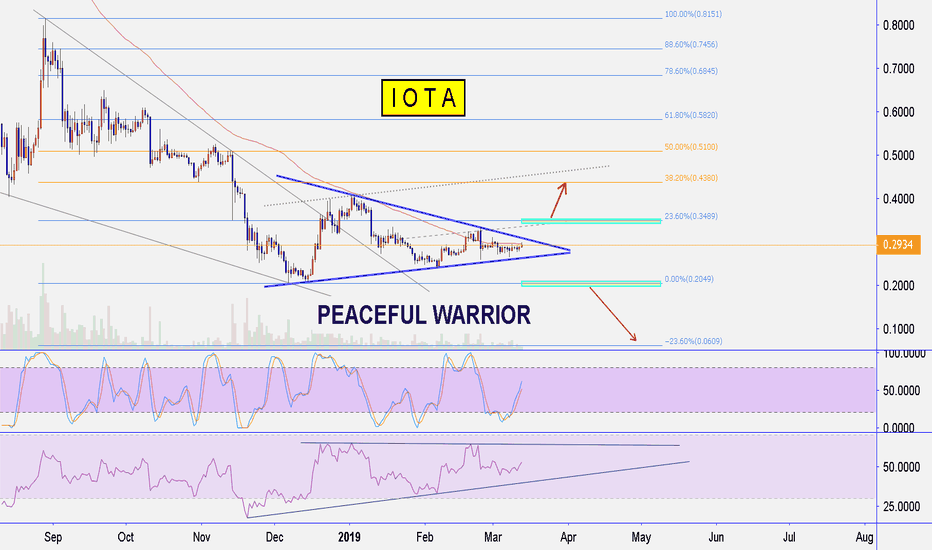
IOTA at critical resistance, upside break possibleNow that BTC went bullish, a lot of alts will also see some strong upside potential.
IOTA looks kind of interesting, because it made a giant bullflag since the bearmarket started.
Also, it is now resting shortly below the daily MA200 and the logarithmic downtrend resistance.
It now depends on BTC. If BTC continues to rise to 6500, IOTA will break through the resistance and certainly go to the next resistance, at around x3 the current price.
If BTC corrects before making the next leg up, IOTA will do the same, and break the downtrend channel in the next try.
This coin seems quite interesting, because it hasn't pumped a lot as compared to its low and is therefore currently undervalued.
IOTA IS LIKE A BOMB READY TO EXPLODEFOR 16 MONTHS, IOTA IS IN A DOWN TREND IN TRIANGLE PATTERN.
THIS RESISTANCE TREND IS VERY STRONG AND IMPORTANT.
LOOK AT THE MA200 , THIS INDICATOR BULLISH TREND .
IF THE PRICE CROSS UP THE MA200 AND THE TRIANGLE PATTERN WITH VOLUME,
THEN IOTA WILL BE IN HUGE BULLUSH RUN.
6X PROFIT MIGHT COME WITH IOTA.
IOTA - Hopium, Hopium, and Hopium...IOTA is looking slightly bullish on the daily timeframe as it is about to break out of the triangle. Not to mention, bulls did an amazing job defending the daily MACD cross right at the zero mark.
On the weekly timeframe, we can see the RSI making a potential inverse head and shoulders pattern. Similar to every inverse head and shoulders pattern, we must wait for the break of neckline resistance as confirmation.
Using a variety of synthetic currency pairs, we can compare the strength/weakness between IOTA and other cryptocurrencies. In this example, we will use synthetic pair IOTUSD/NEOUSD which simplifies into IOT/NEO.
There's a very visible bearish divergence in MACD, RSI, and Stochastic. There's a possibility that money from algo traders that are trading synthetic currency pairs may go into IOTA due to its temporary weakness against other cryptocurrencies. But keep in mind, this is simply a method to compare the strength/weakness between two highly correlated asset. USD value of IOTA does not necessarily have to go up in order for IOT/NEO to go down.
Using IOT/ETH pairing, we could see that we're approaching a long term support trendline with a double bottom starting to form. This further supports my point in IOT/NEO: IOTA should theoretically gain strength compared to other cryptocurrencies in the coming days or weeks.
Just like every single double bottom, a retest of the neckline is necessary. The neckline support must hold or else it would indicate that IOTA is still too weak.
Feel free to share your long-term bearish ideas, it's always good to know both sides.
IOTAIOTUSD / IOTAUSD
Price is narrowing, the volatility subsides before the storm. The question of which way the blow would be would not have taken a decision in the medium term. There is a chance to pass at least 38-50% Fibo on the chart upwards. You also need to consider that we are in a falling trend and the opportunity to go down below 20 cents is very large. Indicators looks for bulls more.
short term tradecould be cup and handle with breakout if whole market goes up,
OR it's at resistance line, can drop back to support.
Day-trade setup; posting only for tracking. Don't do this without own ta!
my entry 32 ; sl 32.5 ; tp 31.5 - .31 - .30/29 if dump may occur this weekend.
Long zhe support from .27 for a bounce trade. Be carefull again for capitulation. Lowest support for iota at .25
There is a trading opportunity to buy in IOTAUSDMidterm forecast:
While the price is above the support 0.2045, beginning of uptrend is expected.
We make sure when the resistance at 0.4015 breaks.
If the support at 0.2045 is broken, the short-term forecast -beginning of uptrend- will be invalid.
Technical analysis:
The RSI bounced from the downtrend #1 and it prevented price from more gains.
A trough is formed in daily chart at 0.2667 on 03/09/2019, so more gains to resistance(s) 0.3340 and maximum to Major Resistance (0.4015) is expected.
Price is above WEMA21, if price drops more, this line can act as dynamic support against more losses.
Relative strength index (RSI) is 49.
Trading suggestion:
There is a possibility of temporary retracement to suggested support zone (0.2660 to 0.2045). if so, traders can set orders based on Price Action and expect to reach short-term targets.
Beginning of entry zone (0.2660)
Ending of entry zone (0.2045)
Entry signal:
Signal to enter the market occurs when the price comes to " Buy zone " then forms one of the reversal patterns, whether " Bullish Engulfing ", " Hammer " or " Valley " in other words, NO entry signal when the price comes to the zone BUT after any of reversal patterns is formed in the zone. To learn more about " Entry signal " and the special version of our " Price Action " strategy FOLLOW our lessons :
Take Profits:
TP1= @ 0.3340
TP2= @ 0.4015
TP3= @ 0.4535
TP4= @ 0.5260
TP5= @ 0.6105
TP6= @ 0.7920
TP7= @ 0.9265
TP8= @ 1.1550
TP9= @ 1.4475
TP10= @ 1.7435
TP11= @ 2.2170
TP12= @ 2.6930
TP13= @ 3.3680
TP14= @ 4.2300
TP15= Free
IOTAUSD updateIOTA reach support ascending triangle.
I mark previous drawdown with false break down happen at previous touch.
Rightnow, we still wait for same drawdown with maximum target at 0.27687556 or maybe lower than that before we have bullish run.
I will update more quick analysis if we have a perfect buy low (depend on price action)
Make sure you hit "LIKE" to get quick update notification.
click to see previous analysis


